Sentiment & Heatmaps
Understand market psychology with real‑time sentiment indicators, bullish/bearish ratios and heatmaps.
Understand market psychology with real‑time sentiment indicators, bullish/bearish ratios and heatmaps.
Sentiment & Heatmaps reveal how traders across the market are positioned. Bullish/bearish ratios, sentiment curves and heatmaps help you understand where momentum is forming, where pressure is building and where reversals are most likely to occur.
Whether you're trading trends, reversals or breakouts, sentiment data gives you the psychological context behind price movement.

A complete sentiment engine designed for clarity and precision.
The bullish/bearish ratio shows how traders are positioned in real time. Perfect for identifying crowded trades, contrarian opportunities and sentiment extremes that often precede reversals.
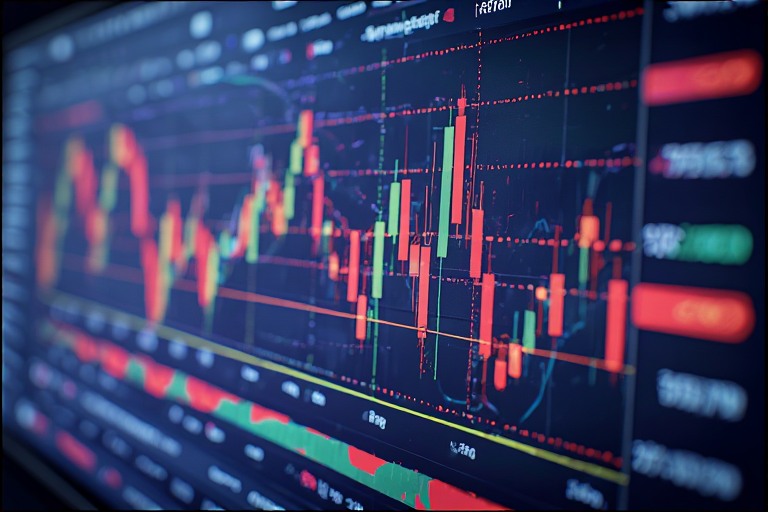
Heatmaps show which assets are strongest, weakest or experiencing unusual activity. A powerful tool for scanning the market quickly and identifying clusters of movement.

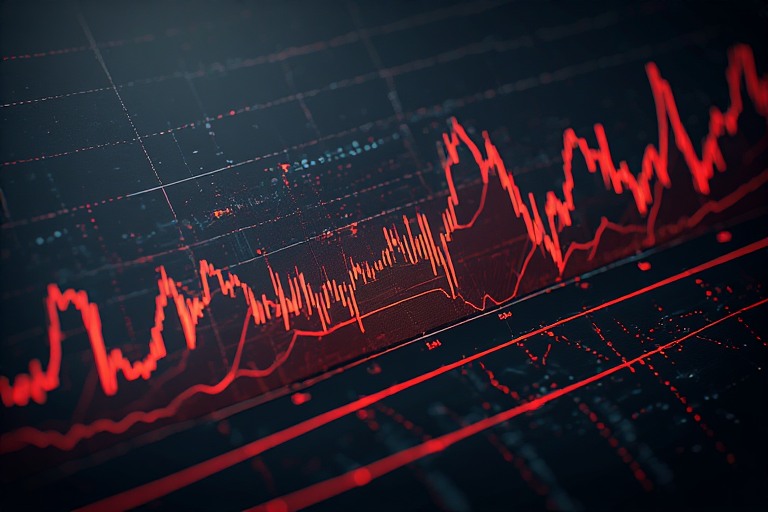
The sentiment curve shows how market psychology evolves over time — highlighting acceleration, exhaustion and early reversal signals before they appear on price charts.
Unlock deeper insights, proprietary datasets, and institutional‑grade market intelligence inside Quantisca’s research ecosystem.