Global Volatility Map
A world‑scale view of volatility — hotspots, calm zones and cross‑market volatility propagation.
A world‑scale view of volatility — hotspots, calm zones and cross‑market volatility propagation.
The Global Volatility Map visualizes how volatility is distributed across major regions and asset classes. It highlights where volatility originates, how it spreads and which markets are entering expansion or compression phases.
This macro‑level perspective helps traders understand global risk conditions, anticipate cross‑market reactions and identify volatility hotspots before they impact local markets.
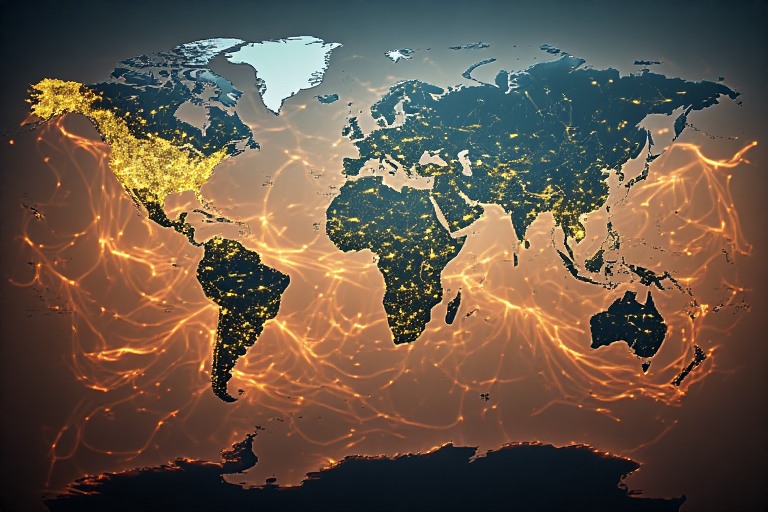
Regional volatility hotspots and cross‑market volatility flows.


Unlock deeper insights, proprietary datasets, and institutional‑grade market intelligence inside Quantisca’s research ecosystem.